

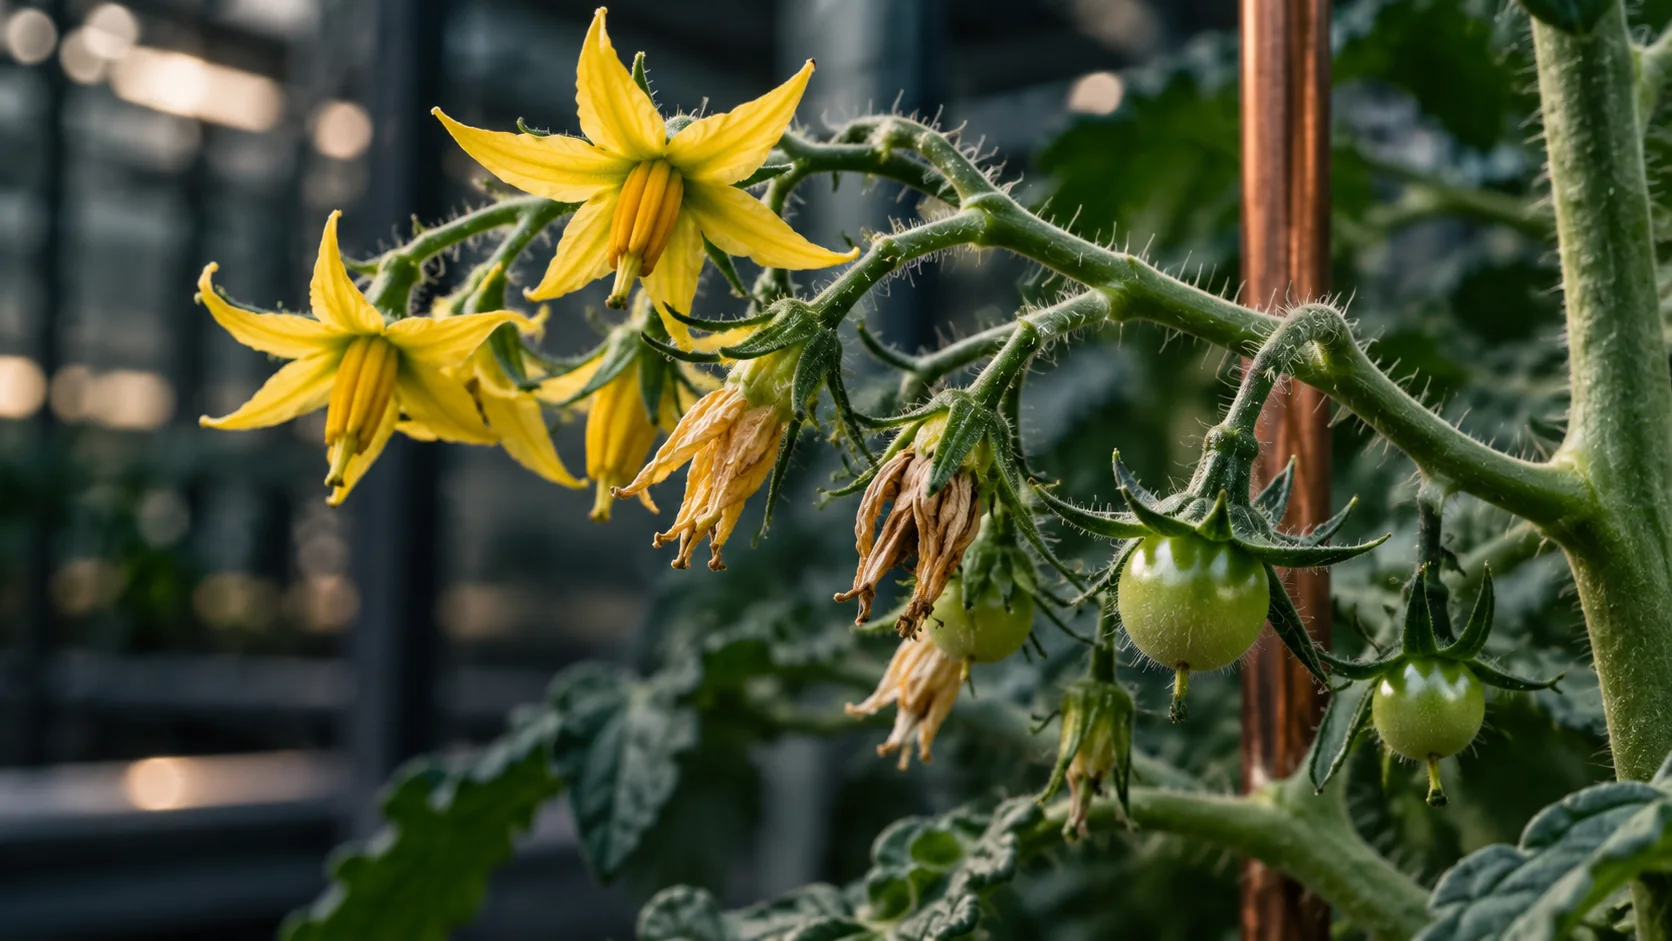
One row has plenty of flowers but fewer developing fruit than the grower expects. The temptation is to pick a familiar explanation: temperature, pollination, nutrition, or a recent operating change. A chart may show an interesting coincidence without showing which explanation is right.
Build a fruit-set investigation around comparable flowers, crop stage, observation timing, and the conditions that could matter to them. The purpose is to help a qualified grower choose the next useful inspection or trial. It is not to turn a correlation into a diagnosis or to apply one pollination prescription to every fruiting crop.
Define the observation before calculating a rate
Decide which flowers are being followed and what counts as developing fruit at the agreed observation point. Comparing today's open flowers with today's visible fruit mixes different stages. A tagged cohort or another crop-appropriate method gives the reviewer a more meaningful denominator.
Record crop, variety, plant group, flower position where relevant, observation dates, and any missing plants or labels. If a flower cannot be followed, keep that outcome unknown rather than calling it a failure. A denominator that silently excludes difficult observations can create a misleading improvement.
University of Minnesota Extension describes different pollination requirements among crops. That variation is a reason to define the crop-specific question first. A method appropriate to one greenhouse tomato system cannot simply be copied to another crop or production arrangement.
Link the relevant window rather than the whole season
The conditions around flowering and subsequent development are more informative than an undifferentiated season average. Retain the environmental window selected by the grower, the measurement locations, and any data gaps. Distinguish conditions observed beside the plants from readings taken elsewhere in the house.
Include the actual pollination arrangement and inspection observations without assuming effectiveness. A supplier visit, hive presence, or equipment command is not a measurement that every flower was successfully pollinated. Keep records of relevant changes so the reviewer can identify plausible alternatives.
University of Maryland Extension discusses pollination problems in high-tunnel tomatoes. Its crop-specific discussion helps frame an investigation; it does not prove that a particular site's poor fruit set has the same cause or justify borrowing its reported results as the business's own forecast.
- Define the cohortUse comparable plants, stages, and observation identifiers.
- Follow the outcomeCount the agreed fruit stage and retain unknown observations.
- Compare the contextReview pollination arrangements and relevant environmental windows.
- Test the questionChoose a grower-approved next observation without assuming causation.
Follow a marked flower group
In a hypothetical greenhouse investigation, the grower selects comparable plant groups in two zones and defines a consistent observation method. The crop register is the source of truth for the marked cohort; the environmental system provides linked context with its original timestamps.
In zone A, 40 marked flowers remain traceable to the agreed observation point, with 28 recorded as developing fruit. That illustrative ratio is 28 divided by 40, or 70 percent. Five additional flowers lost their labels and remain outside that calculable group with an explicit unknown status. The report shows both numbers rather than hiding the lost observations.
Zone B has a different crop stage and cannot yet be compared directly. The grower requests a better-matched follow-up instead of interpreting the initial percentage difference as a treatment effect. The investigator also records that an operating change and an environmental shift occurred in the same period, making a single-cause explanation premature.
The grower or adviser reviews the candidate explanations and chooses a bounded next observation. A proposed change to pollination management or environmental operation requires the appropriate qualified decision. The reporting tool cannot independently alter equipment or instruct crop treatment because one hypothesis ranks highest in a generated summary.
Use a fruit-set investigation sheet
The sheet should contain:
- Cohort: crop, variety, plant group, flower stage, selection method, and observation identifiers.
- Outcome definition: when and how developing fruit is counted, with missing or uncertain observations separate.
- Context: pollination arrangement, inspection notes, environmental window, and changes during the period.
- Comparison: why groups are comparable, what differs, and which differences limit interpretation.
- Hypotheses: candidate explanations, supporting and conflicting evidence, and information still needed.
- Next action: grower-approved inspection or trial, responsible person, timing, and review outcome.
Do not let a dashboard reduce this to a single red or green score. The grower needs to see whether a low ratio represents a real observed pattern, a different developmental stage, or incomplete follow-up. Keep photos as supporting observations, with enough identity to know which flower or plant they show.
Use AI to organize the investigation
Rules can maintain cohort identity and calculate clearly defined ratios. AI can summarize notes, identify an unmatched observation, or assemble evidence for several hypotheses. It should not infer successful pollination from a flower image or present a causal explanation without appropriate evidence.
Start with a small, traceable group and a question the grower genuinely needs answered. Measure how many observations remain comparable and how quickly the team resolves missing context. A useful result may be ruling out a weak explanation or designing a better comparison. That is progress toward a crop decision, even when the honest conclusion is that the first dataset cannot establish the cause.
Sources & further reading
Primary references checked October 19, 2026. Examples are illustrative, not reported client outcomes.
- University of Minnesota Extension describes different pollination requirements among cropsPrimary background for the linked discussion. Use the actual application, current product documents, and qualified review for operating or acceptance decisions.
- University of Maryland Extension discusses pollination problems in high-tunnel tomatoesPrimary background for the linked discussion. Use the actual application, current product documents, and qualified review for operating or acceptance decisions.